Golang Benchmarking: Improving Performance
- With Code Example
- January 17, 2024


The statically typed, compiled language Golang—also referred to as Go—has grown in popularity due to its ease of use, effectiveness, and robust support for concurrent programming. Benchmarking becomes an essential activity for developers as they work to get the best possible performance in their apps. This article will discuss the value of benchmarking in Golang and show you how to use benchmarking effectively to increase function performance.
Why Golang Benchmarking is Crucial
Golang benchmarking is evaluating a piece of code’s performance in order to find bottlenecks, maximise resource utilisation, and improve overall effectiveness. The integrated testing package in Golang offers a stable environment for creating and executing benchmarks. Appropriate benchmarking ensures that code optimisation decisions are well-informed and that modifications yield quantifiable performance gains.
Read: Golang Tutorial for Beginners a Guide
Setting Up Your Benchmark Environment
Be sure you have a reliable testing environment before you begin benchmarking. Golang’s testing package integrates well with benchmarks, facilitating the writing, organising, and running of tests. To store your benchmarks, create a new file called `main_test.go}. To retain code modularity, make sure your function to be benchmarked is in a different file, such as {main.go}.
Here’s a basic directory structure:
project-root/
├── main.go
└── main_test.go
Writing Your First Benchmark
To begin, let’s look at a straightforward example that will show you how to benchmark. Assume we have a function for adding two whole numbers:
// main.go

package main

func Add(a, b int) int {
    return a + b
}
Now, let’s write a benchmark for this Add function:
// main_test.go

package main

import "testing"

func BenchmarkAdd(b *testing.B) {
    for i := 0; i < b.N; i++ {
        Add(3, 5)
    }
}
In this golang benchmark, we use the Benchmark* naming convention, and the benchmarking framework will run the function BenchmarkAdd multiple times to collect statistics. The b.N value represents the number of iterations, and the framework adjusts it dynamically to achieve a reasonable execution time.
Run the benchmark with the following command:
go test -bench=.
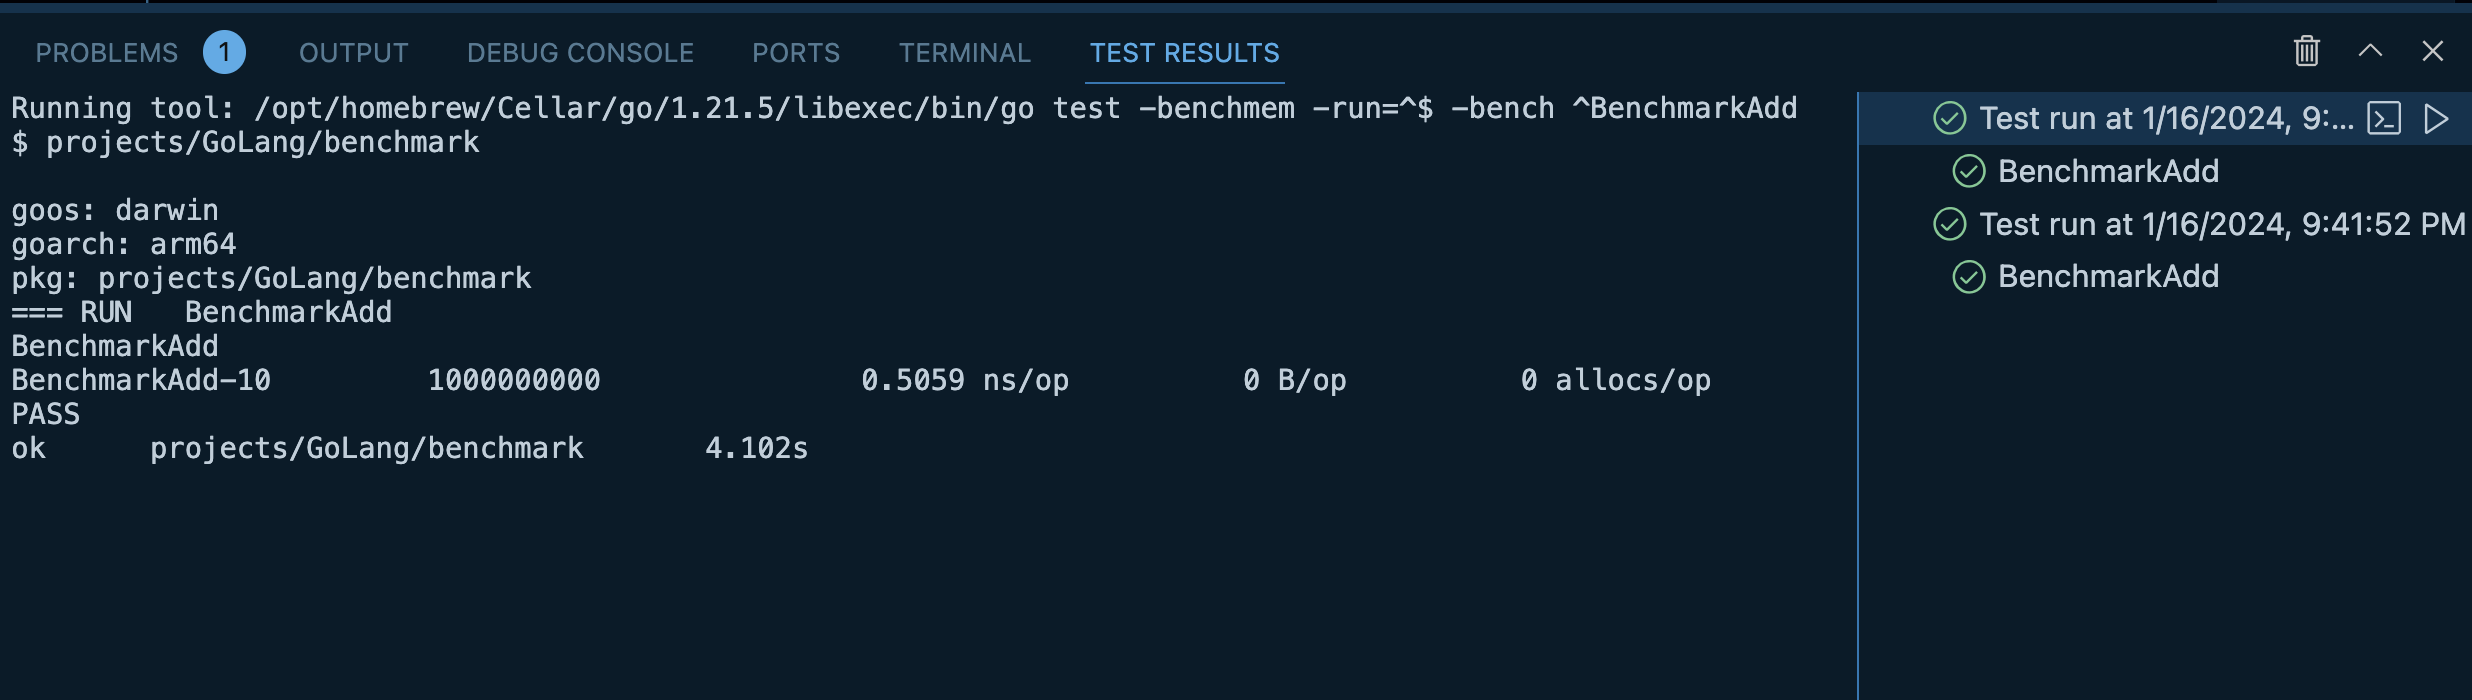
You should see output similar to the following:

The output displays the benchmark name (BenchmarkAdd-8), the number of iterations (1000000000), and the time taken per operation (0.326 ns/op). This information is valuable for understanding the function’s performance characteristics.
Profiling Your Code
Golang provides built-in profiling tools that can be immensely helpful in identifying performance bottlenecks. Two common types of profiles are CPU and memory profiles.
CPU Profiling
CPU profiling helps identify functions that consume the most CPU time. To enable CPU profiling in your benchmark, modify the BenchmarkAdd function as follows:
// main_test.go

package main

import (
    "testing"
    "os"
    "runtime/pprof"
)

func BenchmarkAdd(b *testing.B) {
    f, err := os.Create("cpu.pprof")
    if err != nil {
        b.Fatal(err)
    }
    defer f.Close()

    pprof.StartCPUProfile(f)
    defer pprof.StopCPUProfile()

    for i := 0; i < b.N; i++ {
        Add(3, 5)
    }
}
Run the benchmark and generate the CPU profile:
go test -bench=. -cpuprofile=cpu.pprof
Now, analyze the CPU profile using the go tool pprof command:
go tool pprof cpu.pprof
This opens an interactive shell for exploring the CPU profile. Use the top command to see the functions consuming the most CPU time.
Memory Profiling
Memory profiling helps identify memory usage patterns and potential memory leaks. Update the BenchmarkAdd function to enable memory profiling:
// main_test.go

package main

import (
    "testing"
    "os"
    "runtime/pprof"
)

func BenchmarkAdd(b *testing.B) {
    f, err := os.Create("memory.pprof")
    if err != nil {
        b.Fatal(err)
    }
    defer f.Close()

    pprof.WriteHeapProfile(f)

    for i := 0; i < b.N; i++ {
        Add(3, 5)
    }
}
Run the benchmark and generate the memory profile:
go test -bench=. -memprofile=memory.pprof
Analyze the memory profile using the go tool pprof command:
go tool pprof memory.pprof

Explore memory allocation patterns, and look for areas where memory is not being released as expected.
Optimizing Your Function
Now that you have a benchmark in place and have identified performance bottlenecks using profiling, it’s time to optimize the function. Keep in mind that optimization should be driven by actual performance data, not just intuition.
Example Optimization: Reducing Memory Allocations
Let’s say your Add function is creating unnecessary memory allocations. You can optimize it by using a sync.Pool to reuse memory.
// main.go

package main

import "sync"

var pool = sync.Pool{
    New: func() interface{} {
        return new(int)
    },
}

func Add(a, b int) int {
    result := a + b
    val := pool.Get().(*int)
    *val = result
    defer pool.Put(val)
    return *val
}
This modification reduces the number of memory allocations by reusing an integer pointer from the sync.Pool.
Run the benchmark again and observe the impact of the optimization:
go test -bench=.

Compare the benchmark results before and after the optimization to ensure that the changes lead to measurable improvements.
Conclusion
One of the most important practices for Golang code speed optimisation is benchmarking. Developers may find areas for improvement and learn a lot about the behaviour of their code by using the integrated testing and profiling tools. Remember that optimization decisions should be data-driven, and benchmarking gives the required measurements to make educated choices.
The fundamentals of benchmarking in Golang have been discussed in this article, along with examples of using the testing package and profiling tools to find performance bottlenecks. To further demonstrate the iterative nature of the optimisation process, we have included a basic optimisation scenario.
Benchmarking should become a routine part of your development process as you work on creating and maintaining your Golang apps. Benchmarks should be often reviewed, particularly following code modifications, to make sure optimisations are still working and to identify any possible regressions.
You may build Golang apps that are more effective and performant by implementing benchmarking into your development process. Recall that optimisation is an ongoing process, and that benchmarking may help you gain a better knowledge of your code’s performance characteristics, which is essential for long-term success.
Cheers to optimising and benchmarking!
Read: Go Switch Statement
Related Posts


Golang Garbage Collection: Memory Mastery
Download PDF Garbage collection, a fundamental process in modern programming languages, is the automatic management of memory resources. It ensures that memory occupied by objects that are no longer reachable or useful is reclaimed, preventing memory leaks and optimizing resource utilization.

